Strategic Analysis and Forecasting Solutions: Enrollment & Retention Intelligence Platform
Overhauling student lifecycle analytics for 110+ universities with a unified semantic layer and dynamic multi-tenancy.
Client Identity
Ruffalo Noel Levitz (RNL)
Assigned Role
Power BI Developer / Business Intelligence Engineer
Timeline Window
June 2021 – July 2024
Integration Agent
Brillio LLC
The Business & Technical Challenge
Ruffalo Noel Levitz (RNL) tracks complex datasets across the student lifecycle, spanning enrollment (recruitment funnels, financial aid discount modeling) and retention (student success, drop-out risk warning). Although the backend data pipelines processed data via Azure Data Factory and Databricks, the consumption layer was highly fragmented. Individual university analysts were extracting files into Excel to manually clean, join, and compose reports. Scaling this operational flow to 110+ distinct university clients was labor-intensive, slow, and highly insecure without dynamic data isolation.
The Engineered Solution
We designed a robust semantic modeling and reporting engine. First, we engineered a performant SQL Star Schema with conformed dimensions (Terms, Demographics, Majors) and fact tables (Admissions, Financial Aid). We applied advanced Power Query (M) transformations and leveraged Microsoft Fabric to automate scheduling. Using DAX Studio and Tabular Editor, we optimized VertiPaq engine caching, removing high-cardinality metadata and replacing bidirectional filters with direction-controlled constraints. We implemented a dynamic dynamic Row-Level Security (RLS) registry mapping user AD credentials to specific institution keys, maintaining a single central template for all clients.
Enrollment & Student Retention Analytical Schema Flow
Staging Warehouse
Azure ADF TablesStar-Schema Layer
Fact & Dim ModelsDynamic RLS
110+ University IsolationDecisions Layer
Retention warning on day 1Architectural Phases & Implementation Details
Ingestion & ETL Isolation
Secure SFTP & Azure Blob Storage tables loaded into unified staging layers via Power Query (M) and automated Fabric flows.
Fact-Dimension modeling
Re-engineered complex operational silos into a clean Star Schema, boosting analytical clarity and sub-second calculation speeds.
Advanced DAX Engine
Authored nested time-intelligence models calculating week-by-week enrollment ratios compared precisely to matching historical ranges.
Dynamic Gateways & RLS
Routed secure tenant execution on Power BI Premium, isolating academic datasets based on active session security mappings.
System & Integration Architecture
High-fidelity technical blueprint representing Naveen's Ruffalo Noel Levitz (RNL) project systems and integrations.
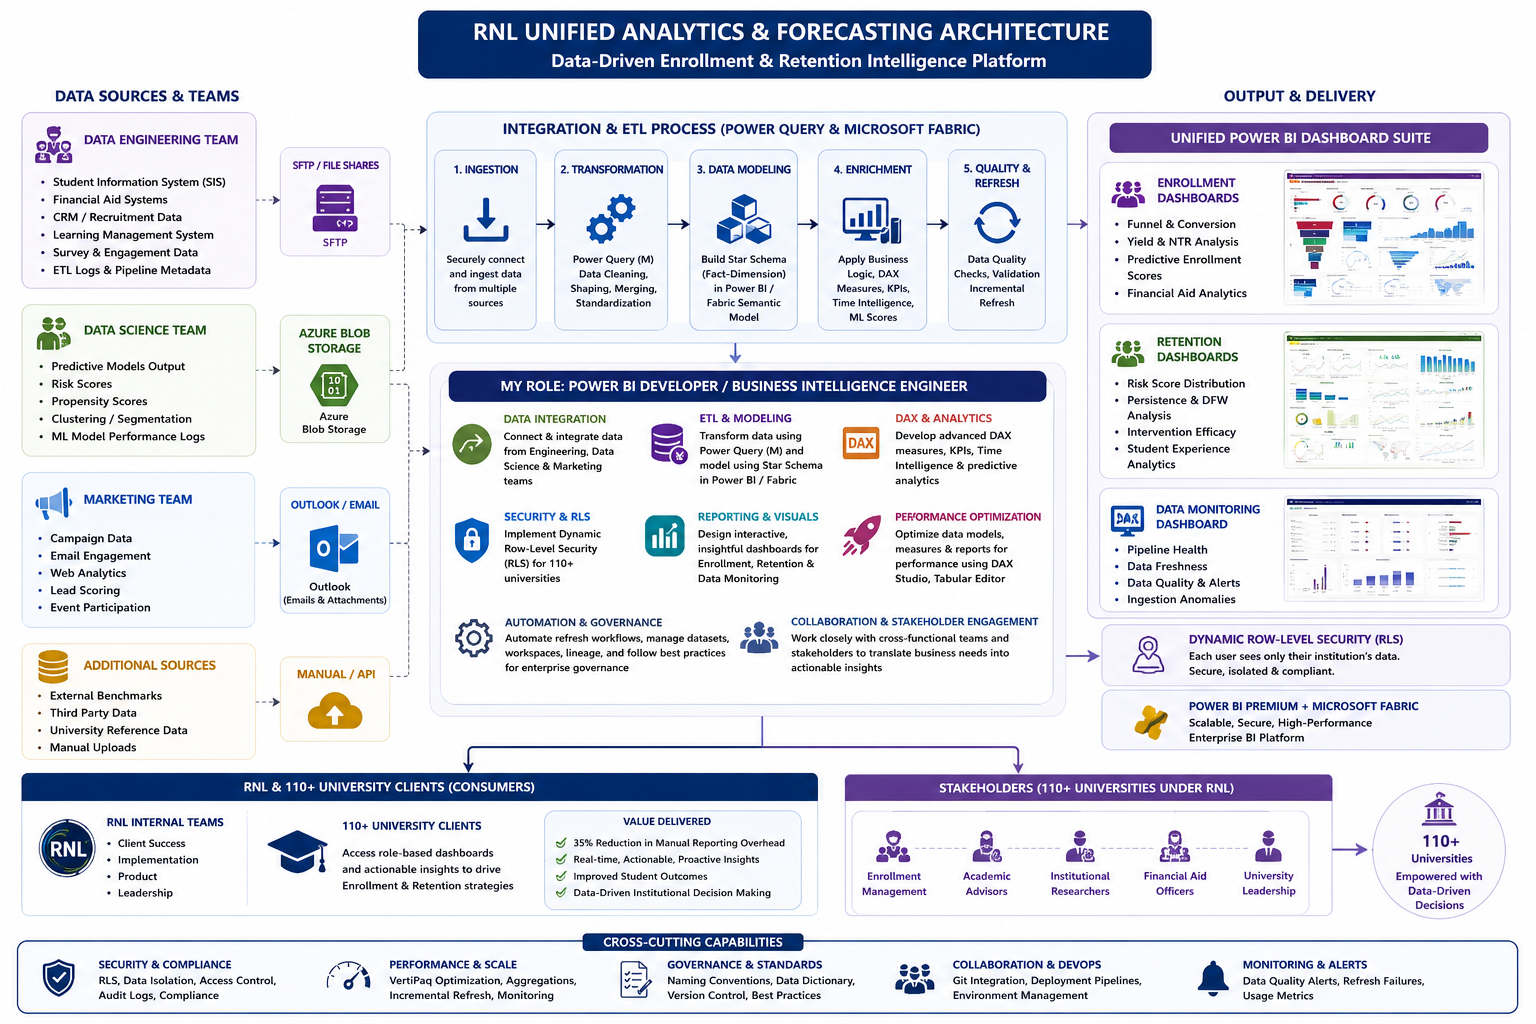
*Click diagram above to inspect technical stages, pipeline sequences, and technology stacks at full magnification.
Measurable Outcomes & ROI
Reporting Efficiency
35% Reduction
In manual analyst work hours reclaimed for proactive counseling.
Universities Served
110+ Tenants
Accessing unified interactive views with full GDPR / FERPA bounds.
Performance Metric
Sub-Second
Report load and rendering times achieved across million-row queries.
Core Outcomes Narrative & Direct Impact
Through systematic star-schema modeling, DAX optimizations, and dynamic multi-tenant security layers:
Engineering Summary Memo
Ruffalo Noel Levitz (RNL) leverages high-volume data arrays to help universities refine their enrollment funnels and student retention strategies. By shifting their ecosystem onto advanced semantic blueprints, we transformed historical statistical reporting into proactive early-warning dashboards. Advisors can now identify high-risk students on day one of a term based on automated risk indexes, and financial aid planners can evaluate Net Tuition Revenue (NTR) variations immediately without manual Excel data-wrangling.